1
2
3
4
5
6
7
8
9
10
11
12
13
14
15
16
17
18
19
20
21
22
23
24
25
26
27
28
29
30
31
32
33
34
35
36
37
38
39
40
41
42
43
44
45
46
47
48
49
50
51
52
53
54
55
56
57
58
59
60
61
62
63
64
65
66
67
68
| from matplotlib.patches import Rectangle
import matplotlib.pyplot as plt
import matplotlib.colors as mcolors
def plot_colortable(colors, title, sort_colors=True, emptycols=0):
cell_width = 212
cell_height = 22
swatch_width = 48
margin = 12
topmargin = 40
if sort_colors is True:
by_hsv = sorted((tuple(mcolors.rgb_to_hsv(mcolors.to_rgb(color))),
name)
for name, color in colors.items())
names = [name for hsv, name in by_hsv]
else:
names = list(colors)
n = len(names)
ncols = 4 - emptycols
nrows = n // ncols + int(n % ncols > 0)
width = cell_width * 4 + 2 * margin
height = cell_height * nrows + margin + topmargin
dpi = 72
fig, ax = plt.subplots(figsize=(width / dpi, height / dpi), dpi=dpi)
fig.subplots_adjust(margin/width, margin/height,
(width-margin)/width, (height-topmargin)/height)
ax.set_xlim(0, cell_width * 4)
ax.set_ylim(cell_height * (nrows-0.5), -cell_height/2.)
ax.yaxis.set_visible(False)
ax.xaxis.set_visible(False)
ax.set_axis_off()
ax.set_title(title, fontsize=24, loc="left", pad=10)
for i, name in enumerate(names):
row = i % nrows
col = i // nrows
y = row * cell_height
swatch_start_x = cell_width * col
text_pos_x = cell_width * col + swatch_width + 7
ax.text(text_pos_x, y, name, fontsize=14,
horizontalalignment='left',
verticalalignment='center')
ax.add_patch(
Rectangle(xy=(swatch_start_x, y-9), width=swatch_width,
height=18, facecolor=colors[name], edgecolor='0.7')
)
return fig
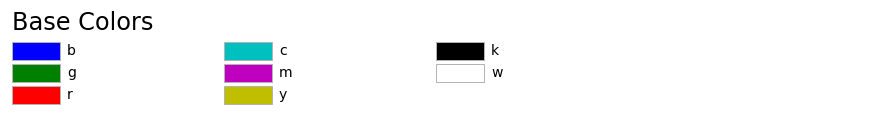
plot_colortable(mcolors.BASE_COLORS, "Base Colors",
sort_colors=False, emptycols=1)
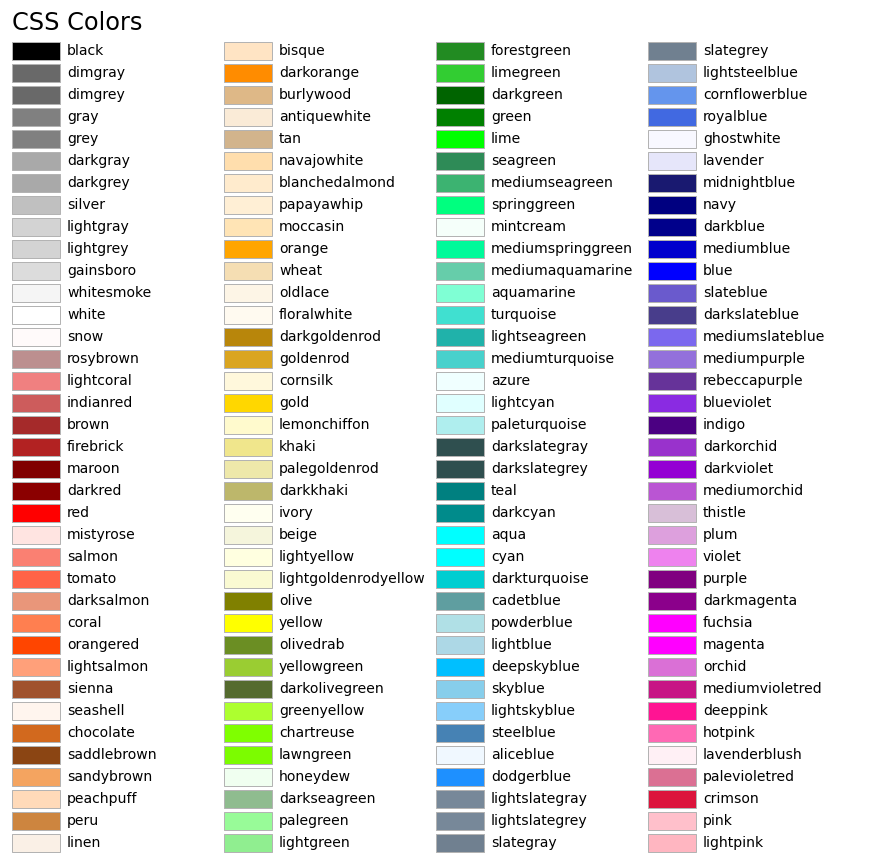
plot_colortable(mcolors.CSS4_COLORS, "CSS Colors")
plt.show()
|